
The performance measures presented below represent performance data across all tenures and include our most recent available information, updated quarterly. This more comprehensive approach is why you may see some variance between these figures and those reported as part of the tenant satisfaction measures, which are reported annually based on data collected over the previous year.
To maintain accuracy, our dedicated performance team thoroughly review all data. This information is then scrutinised by our senior leadership teams and executive board to ensure accuracy before being published. Our resident forum also scruntinise performance information in order to commission resident-led project work to identify opportunities to improve performance and experience of key services. The chosen performance measures have been selected based on resident feedback and will be reviewed regularly by the resident forum.
We hope these measures provide valuable insight into our performance and reinforce our commitment to transparency and service improvement.
If you have any questions or queries about the data, please contact us.
| Service charges | Q3 - December 2024 | Q4 - March 2025 | Q4 - Target |
|---|---|---|---|
% residents consulted on service charge% of service charge estimates issued to residents where they apply (excludes external managing agents). Reported annually. This figure is reported once per year.
|
100% | 100% | 95% |
% service charge accounts served correctly and on time% of variable service charge accounts that are served correctly and on time (based on no of schemes, excludes external managing agents). Reported annually. This figure is reported once per year.
|
80% | 80% | 80% |
Related: Our approach to rent and service charges, Service charges policy
| Repairs | Q3 - December 2024 | Q4 - March 2025 | Q4 - Target |
|---|---|---|---|
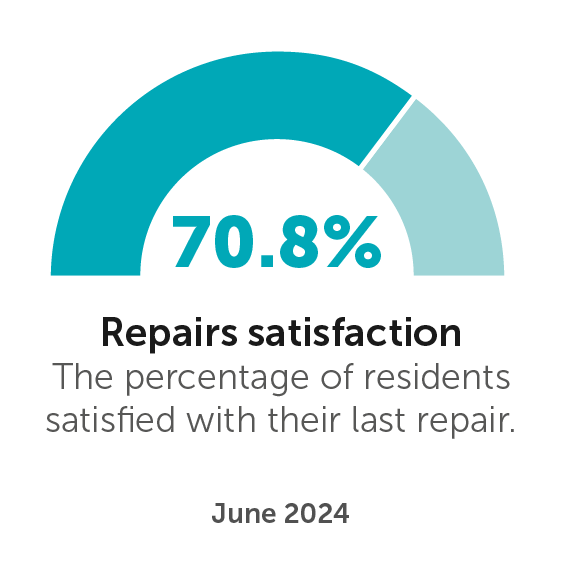
Repairs satisfactionThe percentage of residents satisfied with their last repair. Reported monthly, calculated year-to-date.This figure is updated on a monthly basis and recalculated as a year-to-date figure.
|
80.6% | 81.7% | 87% |
Standard repairs in timePercentage of standard repairs that were completed in time (within 20 working days). Reported monthly, calculated year-to-date.This figure is updated on a monthly basis and recalculated as a year-to-date figure.
|
74.1% | 74.0% | 87% |
Emergency repairs in timePercentage of emergency repairs completed in time (made safe within 24 hours). Reported monthly, calculated year-to-date.This figure is updated on a monthly basis and recalculated as a year-to-date figure.
|
91.0% | 91.9% | 97% |
First time fixPercentage of standard repairs that were fixed first time. Reported monthly, calculated year-to-date.This figure is updated on a monthly basis and recalculated as a year-to-date figure.
|
71.6% | 69.6% | 85% |
% duplicate repairs% of repairs that have been raised as a duplicate. A duplicate repair is counted when the same repair title has been selected and raised as a separate job within the period where the previous job can be recalled. Reported monthly, calculated year-to-date.This figure is updated on a monthly basis and recalculated as a year-to-date figure.
|
7.2% | 6.5% | 10% |
% of appointments kept% of appointments which were scheduled and were attended by the contractor. Inclusive of both emergency and standard repairs. Reported monthly, calculated year-to-date.This figure is updated on a monthly basis and recalculated as a year-to-date figure.
|
86.3% | 84.7% | 95% |
% of recalls% of recalls following job completion within time period. A recall is counted when a job has been recalled within the time period agreed with each contractor. Reported monthly, calculated year-to-date.This figure is updated on a monthly basis and recalculated as a year-to-date figure.
|
0.6% | 0.5% | 15% |
Related: Our approach to repairs, repairs policy
| Satisfaction | Q3 - December 2024 | Q4 - March 2025 | Q4 - Target |
|---|---|---|---|
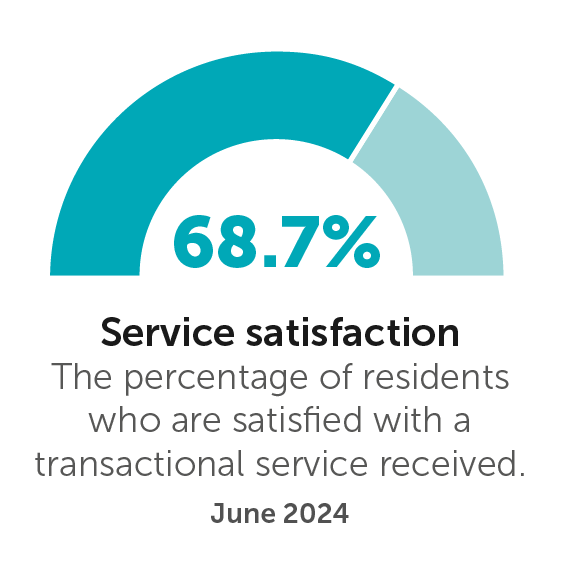
% satisfied with a service receivedThe percentage of residents who are satisfied with a transactional service received (for example, after completion of a repair, after a phone call with customer service centre, after a settling in or other visit with local officer). Reported monthly, calculated year-to-date.This figure is updated on a monthly basis and recalculated as a year-to-date figure.
|
74.1% | 73.9% | 80% |
| Complaints | Q3 - December 2024 | Q4 - March 2025 | Q4 - Target |
|---|---|---|---|
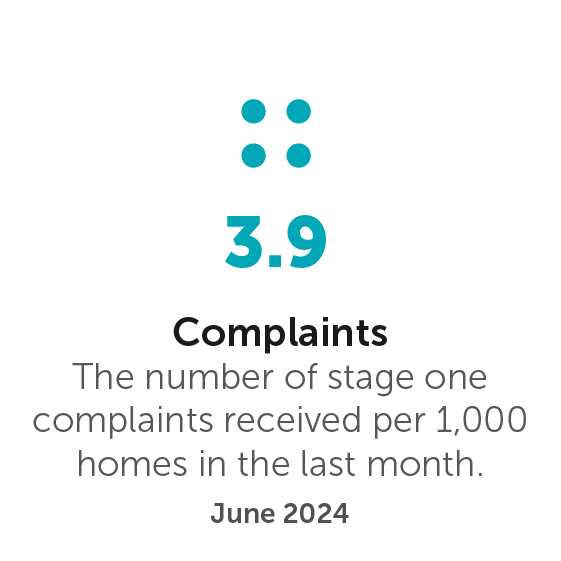
Number of complaints per 1,000 homesThe number of stage one complaints received per 1,000 homes in management in the last month. Reported as monthly snapshot.This figure is reported once per month, based on previous month's performance. Reported per 1,000 homes as a way to be able to compare rates across different areas or groups.
|
5.7 | 13.1 | n/a |
Stage one complaints completed in time% of complaints at stage one responded to within 10 days, or within the time agreed with the resident. Reported monthly, calculated year-to-date.This figure is updated on a monthly basis and recalculated as a year-to-date figure.
|
64.8% | 65.3% | 100% |
Stage two complaints completed in time% of complaints at stage two responded to within 20 days, or within the time agreed with the resident. Reported monthly, calculated year-to-date.This figure is updated on a monthly basis and recalculated as a year-to-date figure.
|
65.3% | 64.1% | 100% |
Escalations% of complaints escalated from stage one to stage two. Reported monthly, calculated year-to-date.This figure is updated on a monthly basis and recalculated as a year-to-date figure.
|
23.4% | 26.1% | 10% |
Detrimental determinationsNumber of negative findings by the Ombudsman such as maladministration or service failure as a % of all findings. Reported monthly, calculated year-to-date.This figure is updated on a monthly basis and recalculated as a year-to-date figure.
|
64.7% | 64.8% | n/a |
Related: Complaints policy, complaints performance
| Anti-social behaviour (ASB) | Q3 - December 2024 | Q4 - March 2025 | Q4 - Target |
|---|---|---|---|
Number of new ASB cases per 1,000 homesThe number of new ASB cases received per 1,000 homes. Reported monthly, calculated year-to-date.This figure is updated on a monthly basis and recalculated as a year-to-date figure. Reported per 1,000 homes as a way to be able to compare rates across different areas or groups.
|
11.6 | 15.6 | n/a |
ASB cases updated in last 10 working daysThe percentage of ASB cases that have been reviewed and updated in the last 10 working days. Reported as monthly snapshot.This figure is reported once per month, based on previous 10-days performance.
|
83.6% | 89.3% | 100% |
Related: Our approach to anti-social behaviour, anti-social behaviour policy
| Arrears and income collection | Q3 - December 2024 | Q4 - March 2025 | Q4 - Target |
|---|---|---|---|
Income collection rateRent and service charge collected as a percentage of the total due. Reported monthly, calculated year-to-date.This figure is updated on a monthly basis and recalculated as a year-to-date figure.
|
98.3% | 99.0% | 100% |
Current tenant arrears %Current tenant arrears as a percentage of annual rent and service charge due. Reported monthly, calculated year-to-date.This figure is updated on a monthly basis and recalculated as a year-to-date figure.
|
5.8% | 5.6% | 4.8% |
Related: Income collection policy
| Planned investment | Q3 - December 2024 | Q4 - March 2025 | Q4 - Target |
|---|---|---|---|
% homes meeting decent homes standard% of homes that meet the Decent Homes Standard. Reported monthly, calculated year-to-date.This figure is updated on a monthly basis and recalculated as a year-to-date figure.
|
99.6% | 99.6% | 100% |
% of statistical data return (SDR) homes inspected within 5-yearsThe percentage of SDR homes (definition)Statistical Data Return (SDR) is an administrative data set collected by the Regulator of Social Housing (RSH) that includes details of low cost rental (social and Affordable Rents) homes. that have been physically inspected to assess DHS compliance over the last 5 years. Reported monthly, calculated year-to-date.This figure is updated on a monthly basis and recalculated as a year-to-date figure.
|
59.7% | 65.9% | 64.0% |
Number of homes improvedNumber of homes improved through either cyclical or kitchen and bathroom works in the 23/24 programme. Reported monthly, calculated year-to-date.This figure is updated on a monthly basis and recalculated as a year-to-date figure.
|
1,112 | 2,126 | 4,288 |
Number of homes improved to energy performance certificate (EPC) rating C or higherThe number of homes that have been improved to EPC C or higher. Reported monthly, calculated year-to-date.This figure is updated on a monthly basis and recalculated as a year-to-date figure.
|
698 | 832 | 1,428 |
Number of stock condition surveys completedA stock condition survey is an important assessment of the condition of the main elements in your home, including the roof, windows, external doors, kitchen, and bathroom. It also helps to make sure that properties are safe and free from any serious hazards and informs whether our homes are decent as per the decent homes standard. Reported monthly, calculated year-to-date.This figure is updated on a monthly basis and recalculated as a year-to-date figure.
|
6,076 | 8,817 | 8,500 |
Customer satisfaction - planned investmentThe percentage of residents satisfied with works completed through the planned programme. Reported monthly, calculated year-to-date.This figure is updated on a monthly basis and recalculated as a year-to-date figure.
|
53.9% | 54.1% | 80% |
Related: Our approach to planned works, Decent Homes Standard
| Compliance
Includes only homes where we are responsible for safety checks. |
Q3 - December 2024 | Q4 - March 2025 | Q4 - Target |
|---|---|---|---|
Overall fire risk assessment compliancePercentage of buildings with both an in-date fire risk assessment and no overdue actions. Reported as monthly snapshot.This figure is a reported monthly and is a snapshot at the end of each month.
|
80.5% | 86.3% | 100% |
Landlord Gas Safety Record complianceHomes with a gas servicing certificate as percentage of those requiring one. Reported as monthly snapshot.This figure is a reported monthly and is a snapshot at the end of each month.
|
99.9% | 99.9% | 100% |
Domestic electrical safety complianceThe percentage of homes with an up-to-date electrical installation condition report without any immediately or potentially dangerous defects. Reported as monthly snapshot.This figure is a reported monthly and is a snapshot at the end of each month.
|
97.8% | 97.3% | 100% |
Communal electrical safety complianceThe percentage of buildings (common areas) with an up-to-date electrical installation condition report without any immediately or potentially dangerous defects. Reported as monthly snapshot.This figure is a reported monthly and is a snapshot at the end of each month.
|
100% | 100% | 100% |
Water safety risk assessment complianceThe percentage of buildings with an up-to-date water risk assessment, review and no overdue actions. Reported as monthly snapshot.This figure is a reported monthly and is a snapshot at the end of each month.
|
100% | 99.8% | 100% |
Communal asbestos survey complianceThe percentage of buildings compliant with asbestos health and safety guidance. Reported as monthly snapshot.This figure is a reported monthly and is a snapshot at the end of each month.
|
100% | 100% | 100% |
Domestic lifts statutory inspection complianceThe percentage of domestic lifts (lifts installed inside of residents' homes) with an in-date statutory inspection. Reported as monthly snapshot.This figure is a reported monthly and is a snapshot at the end of each month.
|
98.9% | 99.8% | 100% |
Passenger lifts statutory inspection complianceThe percentage of passenger lifts (lifts found in communal areas) with an in-date statutory inspection. Reported as monthly snapshot.This figure is a reported monthly and is a snapshot at the end of each month.
|
100% | 100% | 100% |
Related: Safety in your home, building safety policy, gas safety policy,