
We want to provide our customers with the best possible service. We measure how we're performing against our service standards regularly. Performance data is also published in our financial statements and annual standards reports.
In June of this year we will be publishing our first tenant satisfaction measure results on this page.
Better Together scorecard
Our Better Together scorecard is a monthly snapshot of how we are performing against key measures to improve our service to you. It's broken down into three sections corresponding to our strategic priorities and measured against a range of key performance indicators (KPIs) for each section:
- Better connections – getting closer to our residents to ensure we reconnect more fully and address their legitimate concerns by listening actively and empathetically and see our services from their point of view
- Better homes – we want all our residents to have a safe, warm, comfortable home where they can enjoy life and we need to make improvements of one sort or another to the majority of our homes to achieve that
- Better places – recognising that a sense of community plays a crucial role in our residents’ overall experience, we will manage our estates in a holistic, tenure-blind way that meets the needs both of residents and the local community
The progress scores tell us how well we're doing in reaching our goals. The end-of-year (March) target for each of these is 100%. The data is updated on a monthly basis with a one month delay. Please see the legend for an explanation of the status indicators.
 Progress towards better connections ended the year at 84%.
ASB cases updated, the % satisfied with a service received and stage 1 complaints responded to in time, saw a decline in performance compared to the previous month. All other KPIs saw an improvement in performance.
At year end, emergency repairs were within tolerance of target and both service charge measures met target. The remaining 7 KPIs did not reach their targets.

| Better Connections KPI | February 2024 | March 2024 | Target | Status |
|---|---|---|---|---|
| ASB cases updated in last 10 working days
More info % of open ASB cases that have been updated within the last 10 working days.
|
90.9% | 60.6% | 100% |  |
| % satisfied with a service received (YTD)
More info % of residents who are satisfied (scored 4 or 5) with a service they received from us, based on transactional survey responses.
|
75.0% | 74.6% | 80% | |
| Stage 1 complaints completed in time
More info % of stage 1 complaints that have been responded to within 10 working days, or within the time agreed with the resident.
|
71.9% | 71.5% | 100% | |
| Stage 2 complaints completed in time
More info % of stage 2 complaints that have been responded to within 20 working days, or within the time agreed with the resident.
|
76.7% | 76.8% | 100% |  |
| % of homes visited within the last 12 months
More info % of properties that have been visited within the last 12 months (includes annual, regular and settling in/ welcome visits in general needs, temporary housing and key worker housing).
|
76.8% | 77.9% | 100% | |
| Standard repairs in time
More info % of standard repairs that have been completed within 20 working days.
|
73.4% | 73.5% | 86% | |
| Emergency repairs in time
More info % of emergency repairs that have been made safe within 24 hours.
|
91.4% | 91.5% | 96% |  |
| First time fix
More info % of repairs that have been fixed first time.
|
63.2% | 63.8% | 80% | |
| % tenants consulted on service charge
More info % of service charge estimates issued to residents where they apply (excludes external managing agents). Reportable at the end of January.
|
100% | 100% | 100% |  |
| % accounts issued with S20b
More info % of variable service charge accounts that are issued with a S20b (based on no. of schemes, excludes external managing agents).
|
23.0% | 23.0% | 25% | |

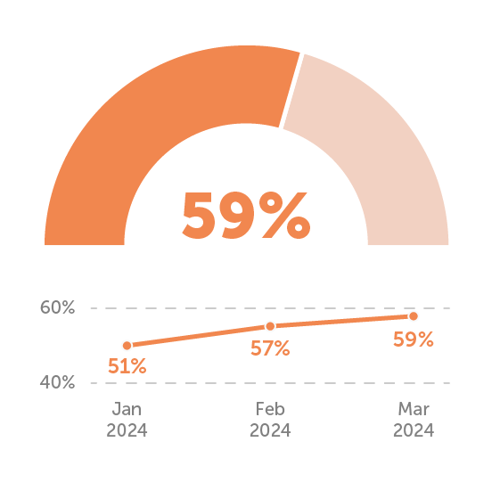
Progress towards better homes ended the year at 59%.
The aggregate compliance measure and the lift shutdown score both saw a decline in performance, whilst all other KPIs saw an improvement compared to the previous month.
The number of open pre-settlement disrepair cases and number of home condition surveys reached their targets. The % of homes meeting decent homes standard was within tolerance of target. The remaining 7 KPIs did not reach their targets.
| Better Homes KPI | February 2024 | March 2024 | Target | Status |
|---|---|---|---|---|
| Damp and mould visits within 10 working days
More info % of damp and mould visits that have been completed within 10 working days.
|
71.3% | 71.5% | 100% | |
| Number of homes affected by damp and mould
More info The total number of properties affected by damp and mould, includes open HHSRS Cat 1 & Cat 2 repairs, open damp and mould repairs, open assets inspections for damp and mould and open damp and mould disrepair cases.
|
2998 | 2890 | 1690 | |
| Number of homes refurbished to Re:New standard
More info The number of properties handed over ready for letting at Re:New standard.
|
171 | 197 | 470 | |
| Lift shutdown score
More info Number of passenger lifts that were out of service.
|
8 | 11 | 0 | |
| Number of open pre-settlement disrepair cases
More info The number of open pre-settlement disrepair cases (where works have not been completed).
|
461 | 445 | 445 |  |
| Number of home condition surveys completed
More info Number of homes where a stock condition survey has been completed.
|
7280 | 8599 | 7500 | |
| Number of homes improved to EPC C
More info The number of properties with a new EPC registered where the EPC has improved to a rating of C or above.
|
291 | 301 | 900 | |
| Number of homes improved (planned programme)
More info Number of homes improved through either cyclical or kitchen and bathroom works in the 23/24 programme.
|
2046 | 3055 | 4440 | |
| % homes meeting decent homes standard
More info % of homes that meet the Decent Homes Standard.
|
99% | 99% | 99.75% |  |
| Aggregate compliance measure
More info % of compliance measures that are meeting or within tolerance of target (includes overall fire, overall gas, domestic and communal electricity, water, asbestos, domestic and passenger lifts).
|
5 | 4 | 8 | |

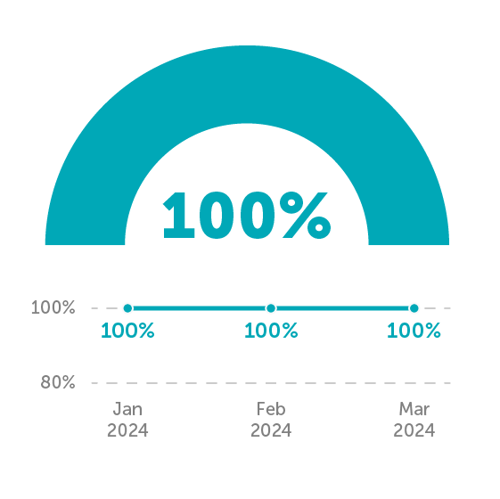
Progress towards better places has reached its target of 100%. The placemaking framework has been rolled out on 18 estates in total:
Factory quarter, Lampton Parkside, St Martin’s Estate, Kidbrooke Square, The Meadows, Stoke Quay, City Park West, Stratford Halo, Oaklands Rise, Heybourne Park, Drayton Green, Coldharbour Lane, Camberwell Fields, Peckham Place, Manor Place Depot, Millharbour, Mildmay and Bolney Meadow.
| Better Places KPI | February 2024 | March 2024 | Target | Status |
|---|---|---|---|---|
| Number of estates placemaking framework rolled out to
More info Number of estates where the placemaking framework has been full rolled out.
|
18 | 18 | 18 | |


